Custom Color Patch Sequence Generator
Access to this tool requires a Premium membership.
Overview
This tool allows you to create custom color patch sequences that can be used in , Calman or any other calibration solution that allows the import of custom patch sequences.
You can create Generated Grid Sequences, Manual Grid Sequences or complete Custom Patch Sets.
For grid sequences, grid size can be anything between 3-50, so the maximum profile size is 50^3. The current internal pre-defined Lightspace limit is 21^3, so now you can go beyond that.
The interface allows to change bit-depth, define custom greyscale points, define the patch format (linear | weighted | reverse weighted | original Lightspace), sort the the patches (very useful for Plasma ABL issues), reverse the patch order and remove patches below a specific brightness threshold (this is very useful for meter that struggle reading lower brightness level).
After you have chosen your settings the tool will display detailed color patch set statistics including 2D Hue|Saturation|Brightness graphs and a 3D RGB Color Cube (with zoom/rotate/filter functionality) about the created patch set, with the option to then save the color patch sequence to your computer.
If you need an explanation about the profile statistics, please go here.
Quick Links
Custom Patch Set Section
- this section allows you to freely create your patch set using H|S|B controls or use predefined patch sets
- you can define which hues tou want to include in your patch set, then which brightness level you want to sample for each hue and then which saturation level you want to sample either for a hue or for each brightness level
- there are many advanced controls that let you target and sample every possible combination. For example, you can create special rules that overrule the main rule that you have defined once a condition is met. This gives you full control over the hue/saturation/brightness level that you want to include in your set.
- you can also include Greyscale points in your patch set (up to 101 Greyscale points) or simply create a patch set that only contains Greyscale patches
- you can also choose from a list of predefined color patch sets that are very useful for display performance validation (see screenshot below)
- this section also includes 3 color sort options (important for Plasma profiling) and a patch removal option that targets a user definable brightness threshold
Screenshot of Custom Patch Set Interface:

Screenshot of Predefined Patch Set Options

Screenshot of HSB Overview Graphs of large patch set with custom hue spacing

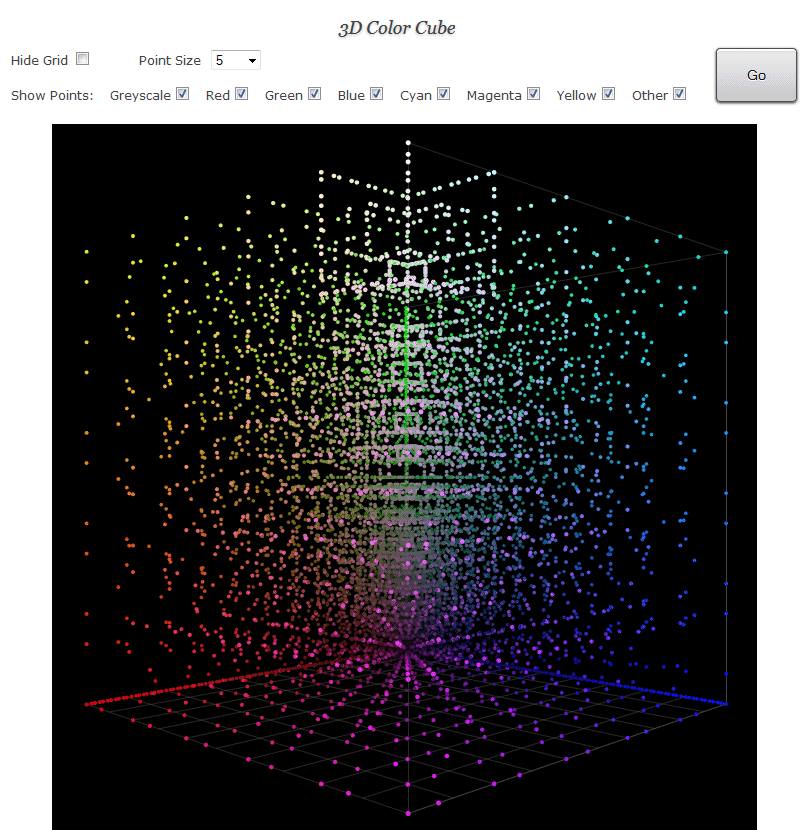
Screenshot of 3D RGB Color Cube of custom 9,137 patch set:
Generated Grid Sequence Section
- this section will generate a 3D custom color patch sequence from the options that you have selected. Lightspace internally uses generated grid sequences and if you choose original Lightspace sequence you can see exactly these sequences. But now you can make adjustments to these sequences, making them even more effective for the calibration of your particular display. Supported grid sequence size is 3-50, so the maximum profile size is 50^3.
- as you can see from the screenshot below, there are weight options (linear | weighted | reverse weighted). If you look at an original Lightspace 1D sequence, you can see it is weighted (it is not linear). Now you can control how much (uniform) weight / reverse weight you want to apply or simply use a linear sequence.
- in addition, you can add a custom Greyscale (up to 100 Greyscale points), there are sort options (this is of interest for Plasma displays) and you can remove patches below a brightness level at which your probe would fail or give inaccurate readings which would contaminate your profile with bad data.
Screenshot of Generated Grid Sequence Interface

- this section will generate a 3D custom color patch sequence from the grid sequence points that you provide as well as the options that you select. This gives even more control than the Generated Grid Sequence section, as you can define any grid sequence and shift weight as you like within the sequence. Supported grid sequence size is 3-50, so the maximum profile size is 50^3.
- as you can see from the screenshot below, you can add a custom Greyscale (up to 100 Greyscale points), there are sort options (this is of interest for Plasma displays) and you can remove patches below a brightness level at which your probe would fail or give inaccurate readings which would contaminate your profile with bad data.
Screenshot of Manual Grid Sequence Interface

Screenshot of 3D RGB Color Cube Of Custom Patch Set For Lumagen Radiance Mini 3D
The custom patch set below was created using the Manual Grid Sequence Interface. It was specifically designed for the Lumagen Radiance Mini 3D which stores 5^3 LUTs. Greyscale points have been removed from the cube for better viewing.

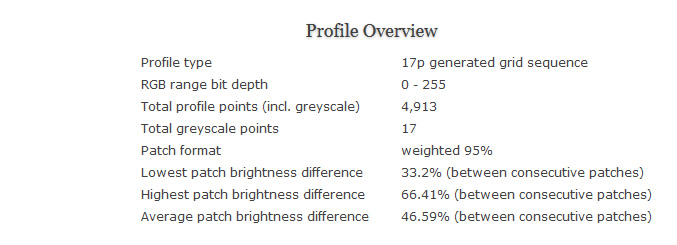
Screenshot of Profile Overview Of 17p
Screenshot of 1D Grid Sequence Graph Of Linear Profile Set
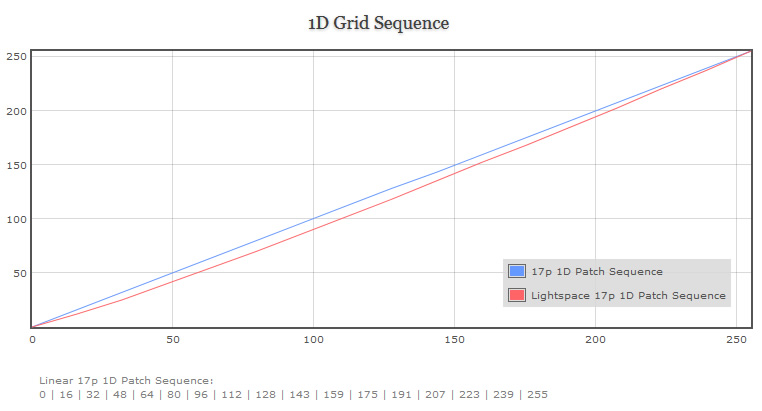
Screenshot of 1D Grid Sequence Graph Of Grid Sequence With 100% Weight Applied

Screenshot of 1D Grid Sequence Graph Of Grid Sequence With 50% Reverse Weight Applied

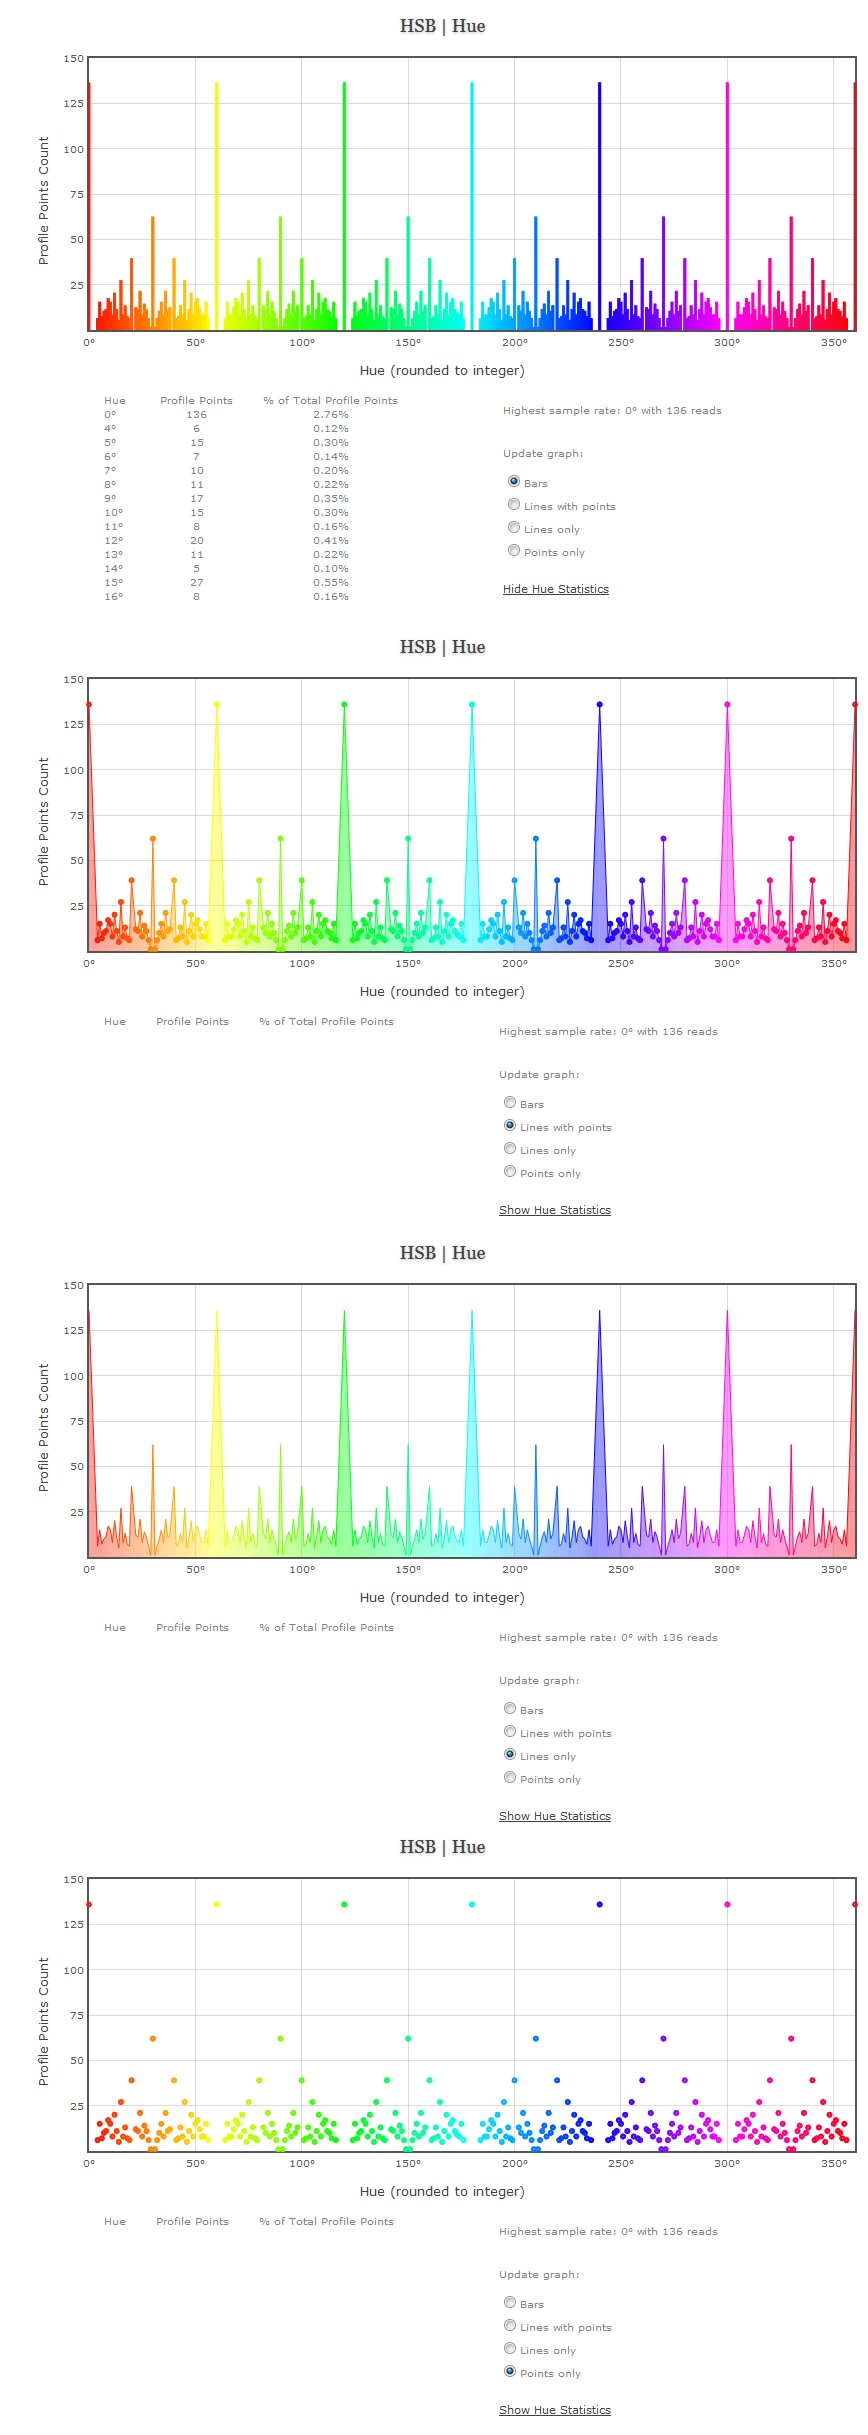
Screenshots of HSB Hue Graph of a 17^3 grid sequence patch set with custom 26 point Greyscale. Screenshot shows all 4 graph types for the same Hue data. The detailed Hue statistics were displayed (and then cut off) in the first image and hidden in all other images. As can be seen on the graphs, displaying the same data in different ways reveals specific characteristics of the patch sequence.
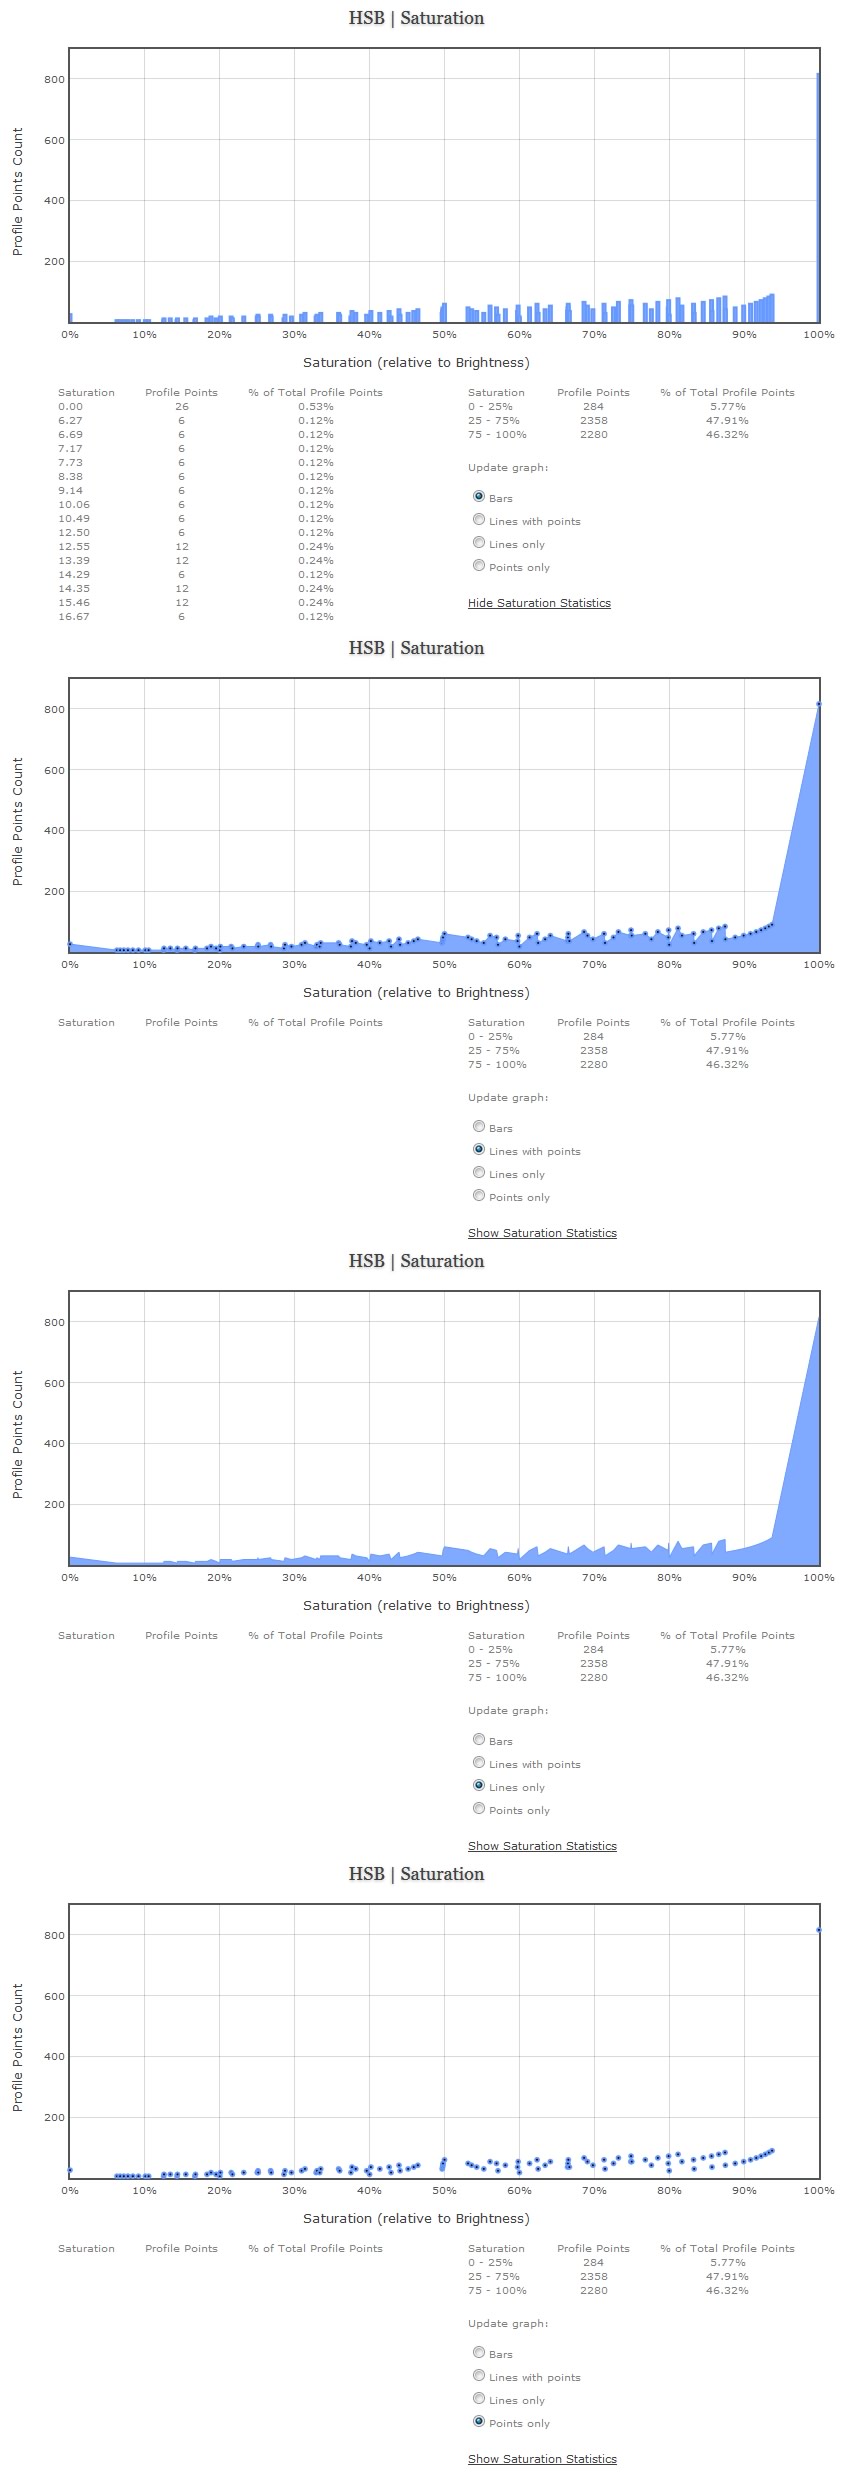
Screenshots of HSB Saturation Graph showing all 4 graph types displaying Saturation data of the same color patch sequence. The detailed Saturation statistics were displayed (and then cut off) in the first image and hidden in all other images. As can be seen on the graphs, displaying the same data in different ways reveals specific characteristics of the patch sequence.
Screenshots of HSB Brightness Graph showing all 4 graph types displaying Brightness data of the same color patch sequence. The detailed Brightness statistics were displayed (and then cut off) in the first image and hidden in all other images. As can be seen on the graphs, displaying the same data in different ways reveals specific characteristics of the patch sequence.

Screenshot of 3D RGB Color Cube of a 17^3 grid sequence patch set with custom 26 point Greyscale
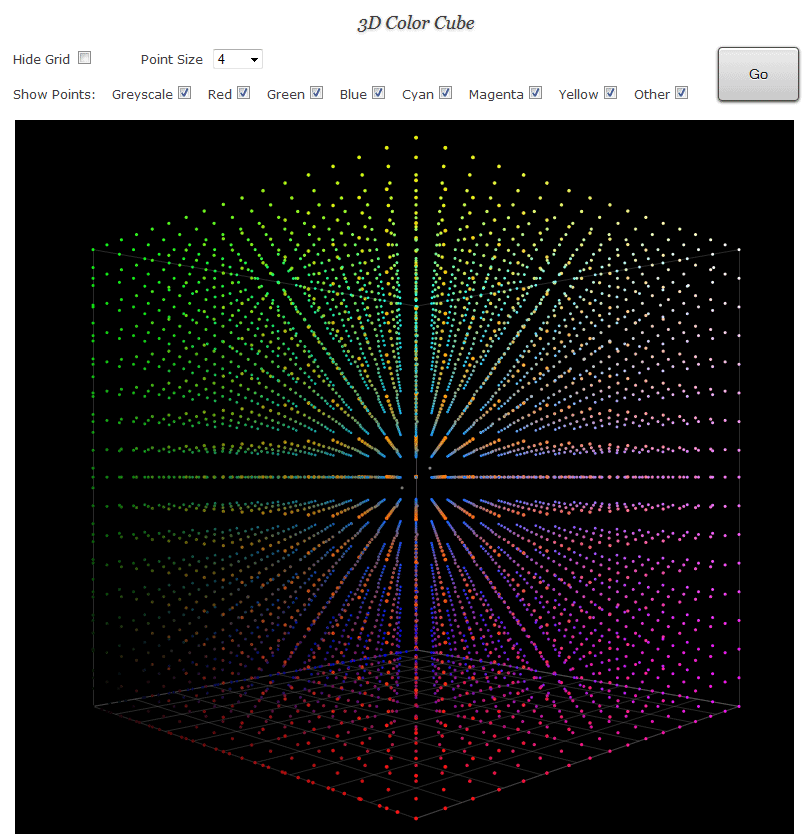
Screenshot of 3D RGB Color Cube of a custom 9,137 patch set

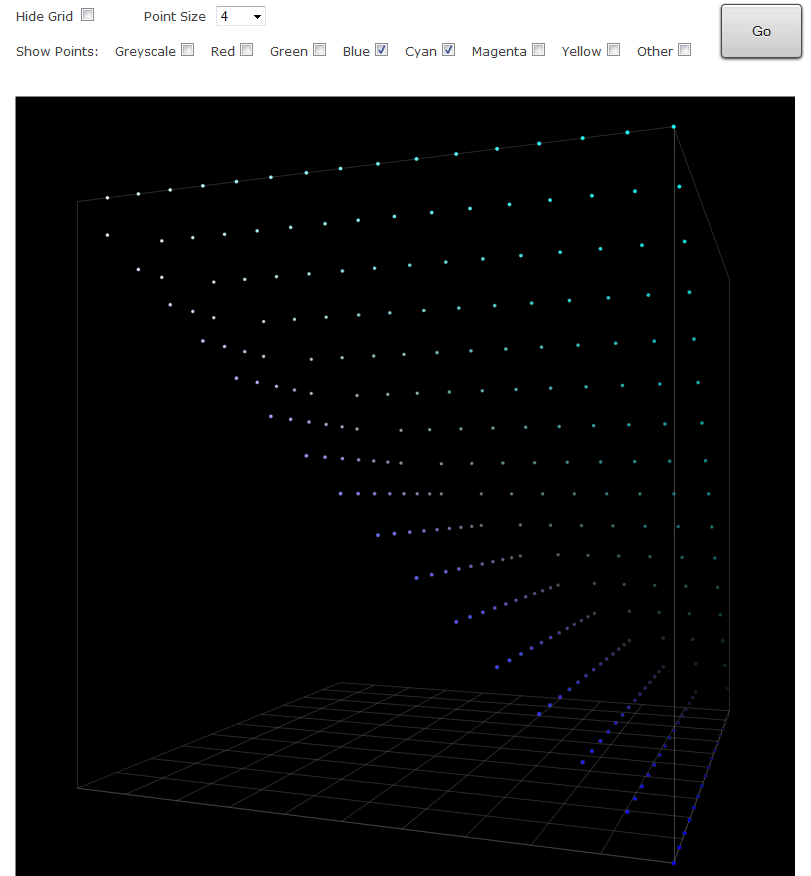
Screenshot of 3D RGB Color Cube of a custom grid sequence patch set with point size set to 4 and filtered by Blue & Cyan color points
