Lightspace Profile Reporter
Access to this tool requires a Premium membership.
Overview

The Profile Reporter tool displays detailed validation & verification statistics of Lightspace profiles. You can analyze any Lightspace profile, whether it be Lightspace Quick Profiles, Lightspace Display Calibration Profiles (using traditional Lightspace color patch sequences) or Custom Lightspace Profiles using custom color patch sequences.
You can target various color targets (Rec 709, BT.1886, DCI etc) and for Rec 709 you can specify which target Gamma (e.g. 2.20, 2.25 etc) you want to validate against.
The profile report includes many, many statistics including various delta E reports and delta E graphs for each color group (W|R|G|B|C|M|Y|Other|All) - validating against 4 different delta E formulas. The profile points are grouped in various statistical overviews making it easy for you to find the data you are looking for. Every single profile point is validated in the report.
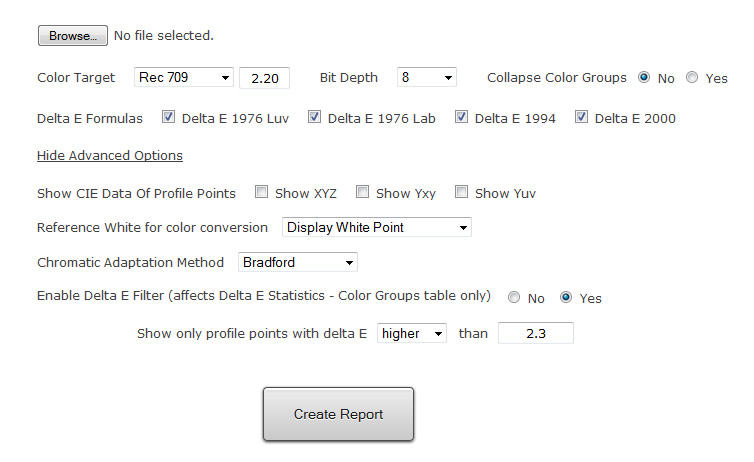
Here's an overview of the option features:
- specify a Lightspace profile via the Browse... button
- choose color target: Rec 709 | BT.1886 | sRGB | DCI P3 | DCI XYZ
- if Rec 709, you can specify the Gamma target, e.g. 2.20 | 2.25 | 2.35 | etc
- choose delta E formulas to validate against: delta E 1976 Luv | delta E 1976 Lab | delta E 1994 | delta E 2000
- Advanced Options
- Show CIE Data: allows you to show additional delta E data for every profile point (XYZ | Yxy | Yuv)
- Reference White: allows you to choose which Reference White Point is used in color conversion calculations, white point options are: Display White Point, Color Target White Point, A, B, C, D50, D55, D65, D75, DCI P3, DCI XYZ, E, F2, F7, F11
- Chromatic Adaptation Method: allows you to choose a Chromatic Adaptation Transform (CAT) method to compensate for white point changes. CAT options are: Bradford, von Kries, XYZ Scaling
- Delta E filter: allows you to enable a Delta E filter which will only display profile points that are above or below a delta E threshold that you define. This is a very useful evaluation tool which quickly reveals which parts / regions of the display's gamut are performing good or poorly.
Screenshot of Options Interface
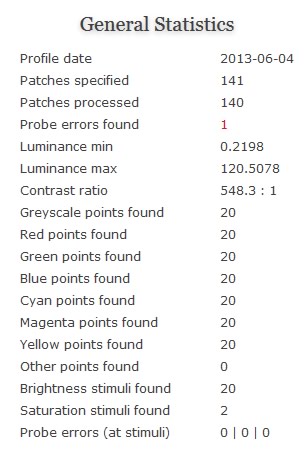
The report starts with general statistics of the profile:
- show profile date
- show number of color patches in profile
- show number of color patches found for each color group: W|R|G|B|C|M|Y|Other
- show number of probe errors in profile and list the stimuli points of the probe errors
- show max and min luminance
- calculate contrast ratio
- list the number of unique brightness and saturation stimuli levels found in the profile
Screenshot of General Statistics of a standard Lightspace Quick Profile (with one probe error)
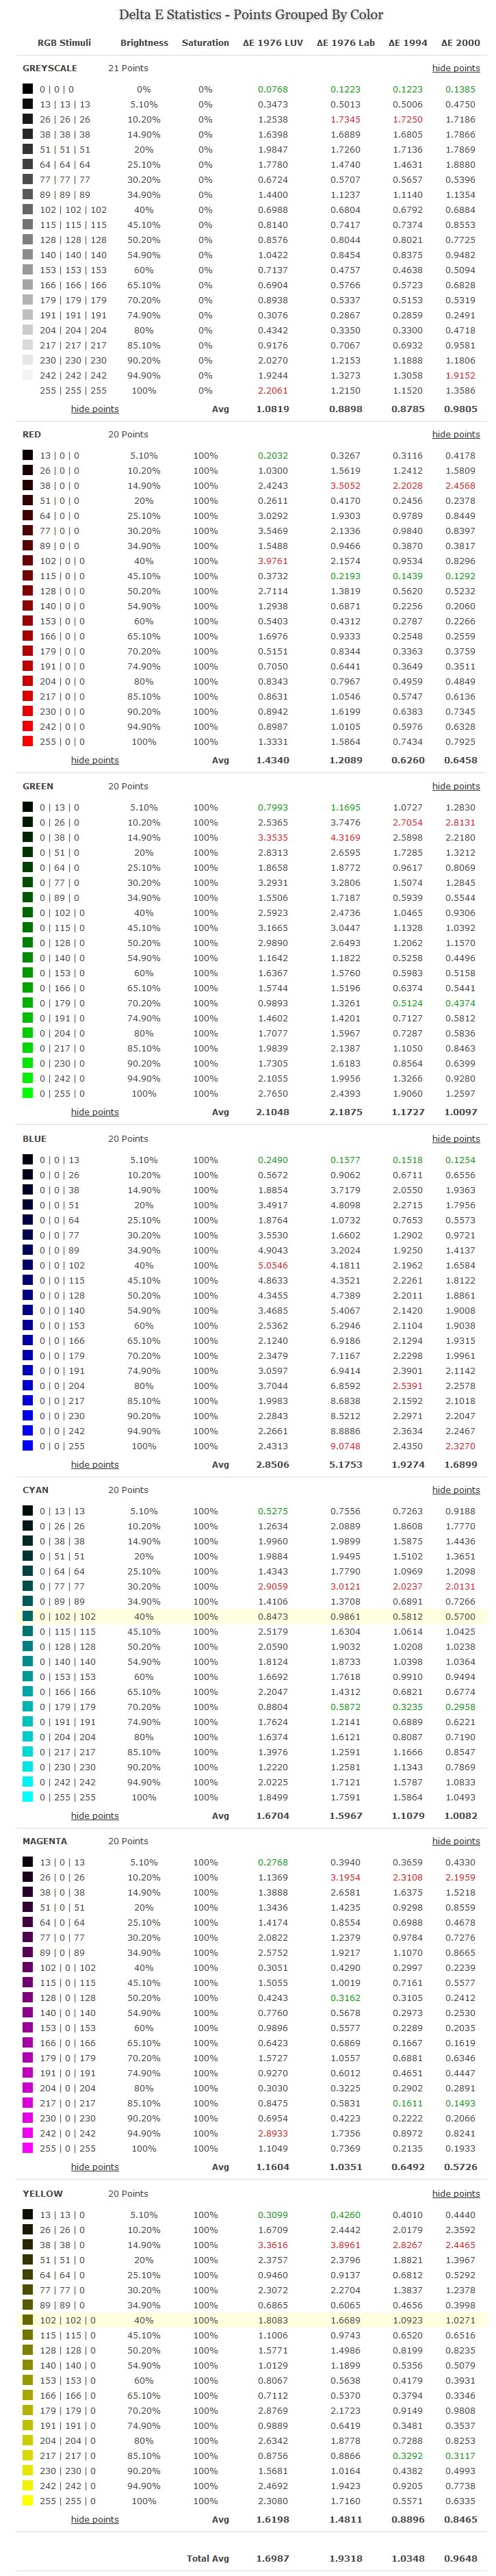
The report then shows a Delta E Statistics overview table - all profile points grouped by color:
- color groups are: W|R|G|B|C|M|Y|Other
- each color group is only shown if points (for the particular color group) were found in the profile, in the screenshot below of a standard Lightspace Quick Profile no "Other" points were found in the profile
- shows number of points found for each color group
- show RGB stimuli so u can cross reference delta E results to the stimuli points for the chosen bit depth
- shows brightness stimuli of color patch point
- shows saturation stimuli of color patch point
- shows delta E result for each delta E formula that you have selected in the options interface
- highlights the highest and lowest delta E number for each formula within a color group
- shows average delta E number for each delta E formula for each color group
- shows average delta E number for each delta E formula for all points
Screenshot of Delta E Statistics Table (points grouped by Color) of a standard Lightspace Quick Profile with 141 points.
A standard Lightspace QP does not have OTHER points, that is why they are not listed in this delta E table. If u hover the mouse
over a row it will be highlighted in light yellow as can be seen in the Cyan and Yellow color group.
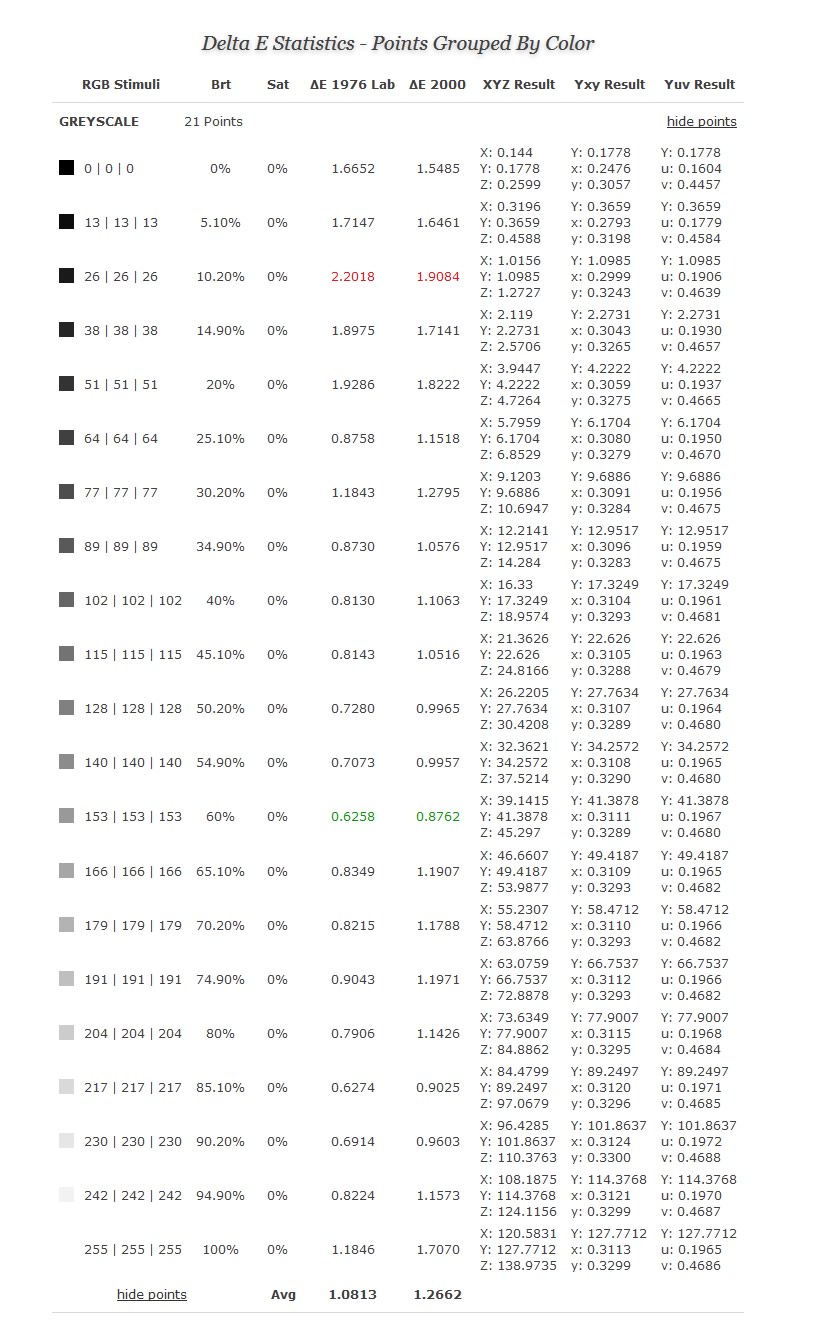
Screenshot of Delta E Statistics Table (points grouped by Color, showing Greyscale only) displaying delta E 1994, delta E 2000 and XYZ, Yxy and Yuv data of the probe read result.
The report then shows two additional Delta E Statistics overview tables:
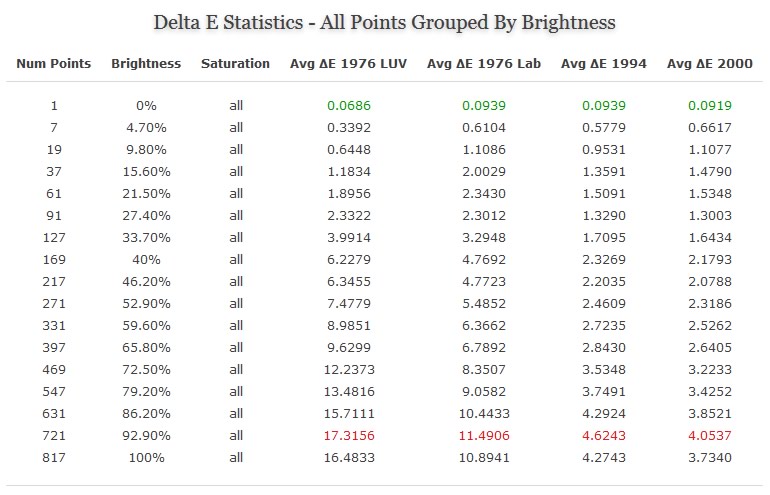
- all profile points grouped brightness with all points (and their various saturation levels) being averaged for a given brightness stimuli
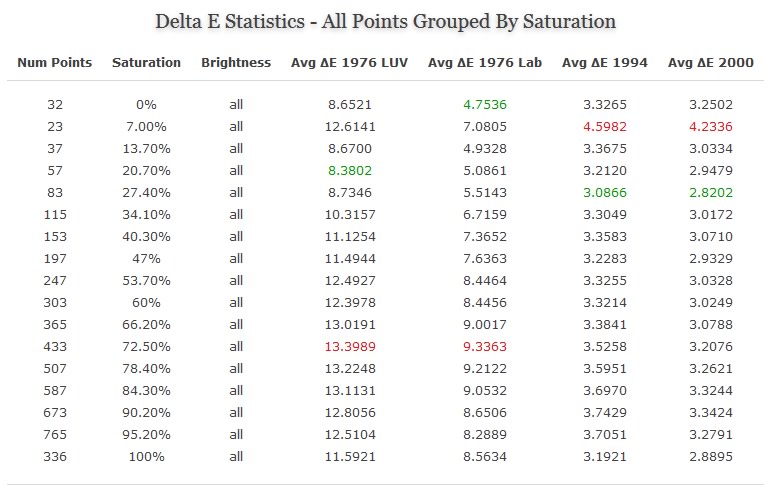
- all profile points grouped saturation with all points (and their various brightness levels) being averaged for a given saturation stimuli. Please note that this graph is only displayed if a minimum of 3 unique saturation stimuli are found in the profile.
Screenshot of Delta E Statistics Table (points grouped by Brightness) of a 17^3 Lightspace Profile (4913 points)
Screenshot of Delta E Statistics Table (points grouped by Saturation) of a 17^3 Lightspace Profile (4913 points)
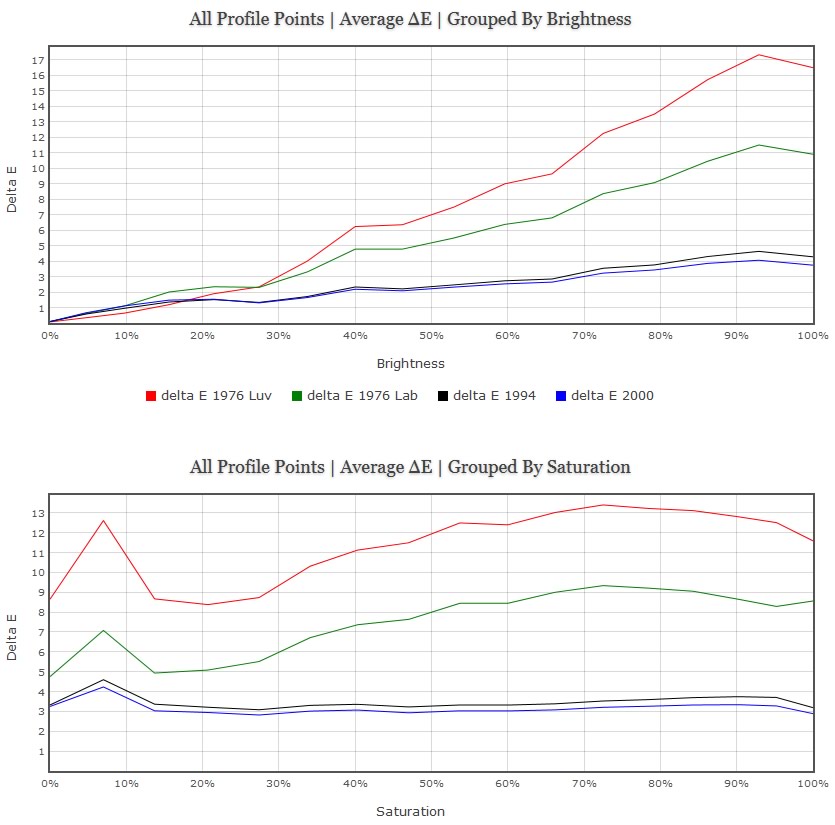
The report then shows the two corresponding graphs of the last two Delta E Statistics overview tables (points grouped by brightness & points grouped by saturation)
- the graph will show the delta E formulas that you have selected in the options interface:
Screenshot of Delta E Statistics graphs (points grouped by Brightness & points grouped by Saturation) of a 17^3 Lightspace Profile (4913 points)
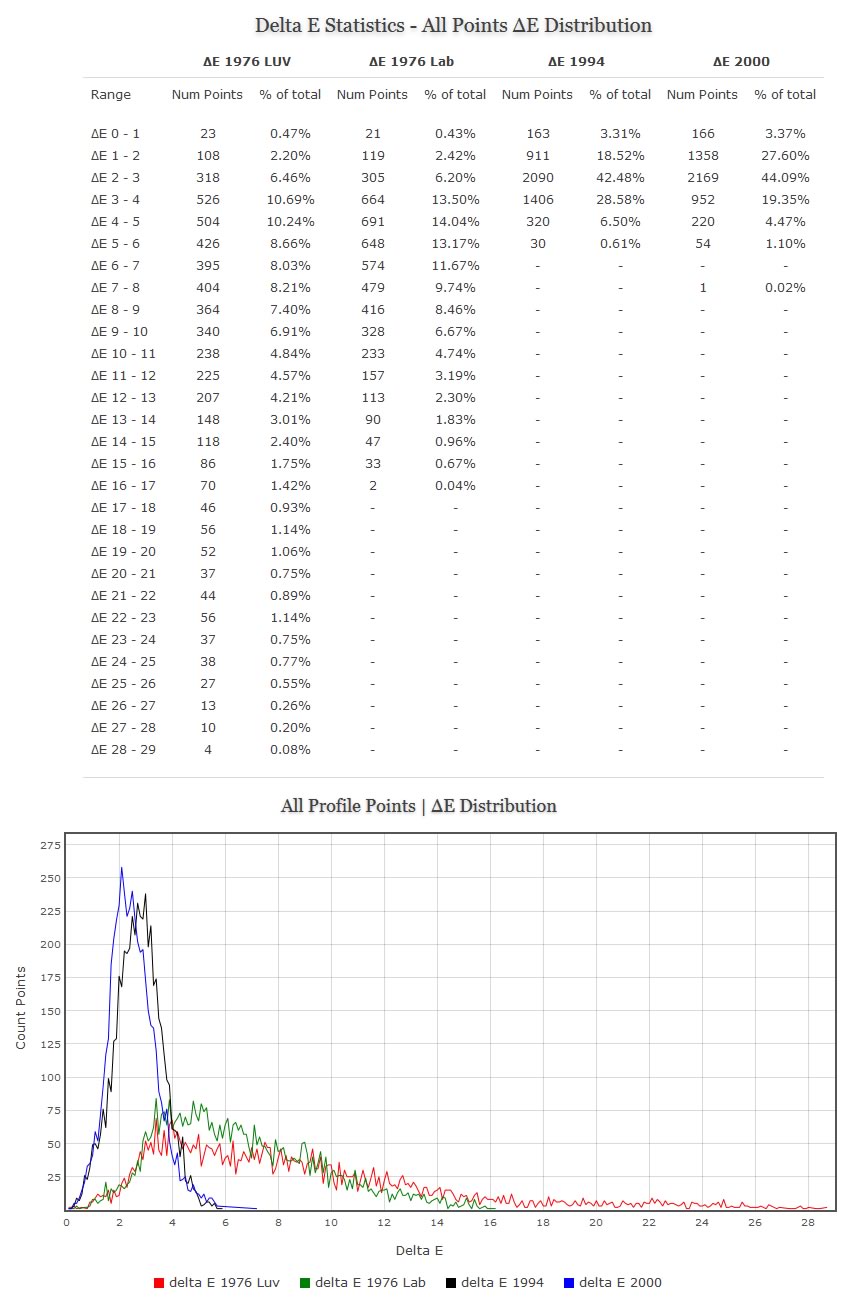
The report then shows a delta E distribution overview table and graph displaying the distribution of delta E results from all profile points across the entire delta E range:
Screenshot of Delta E Statistics Delta E distribution overview table and graph of a custom 17^3 Lightspace profile (26 point custom greyscale)
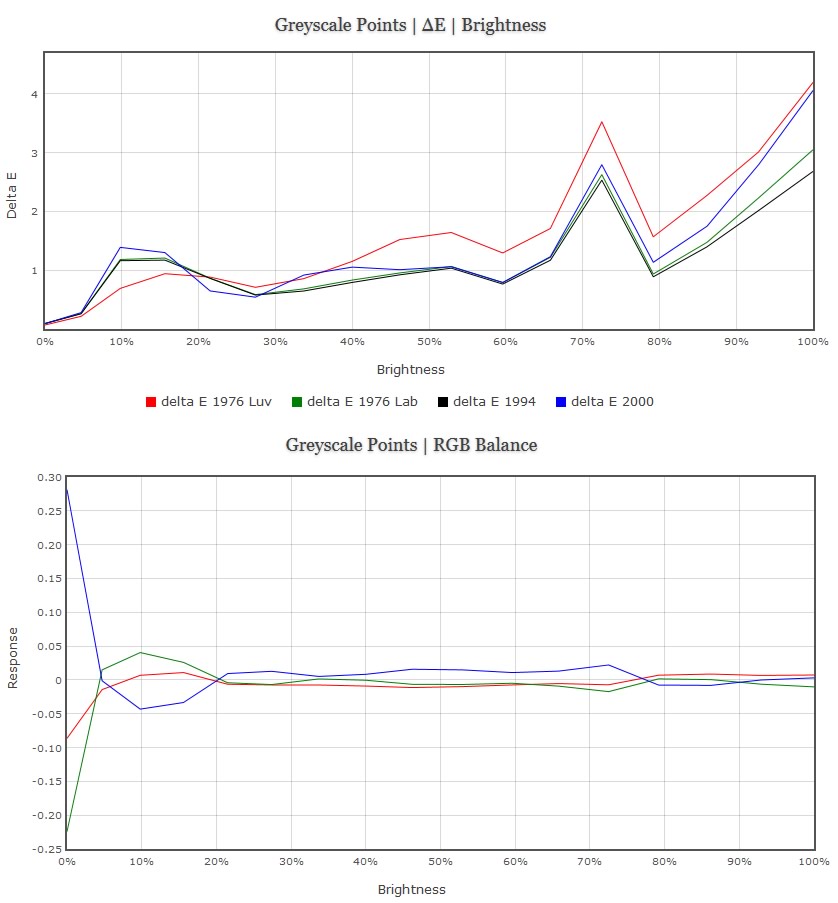
The report then shows a Delta E graph (displaying the delta E formulas that you have selected in the options interface) of the Greyscale points found in the
profile as well as a RGB balance graph.
Screenshot of Delta E graphs Greyscale & RGB Balance graph
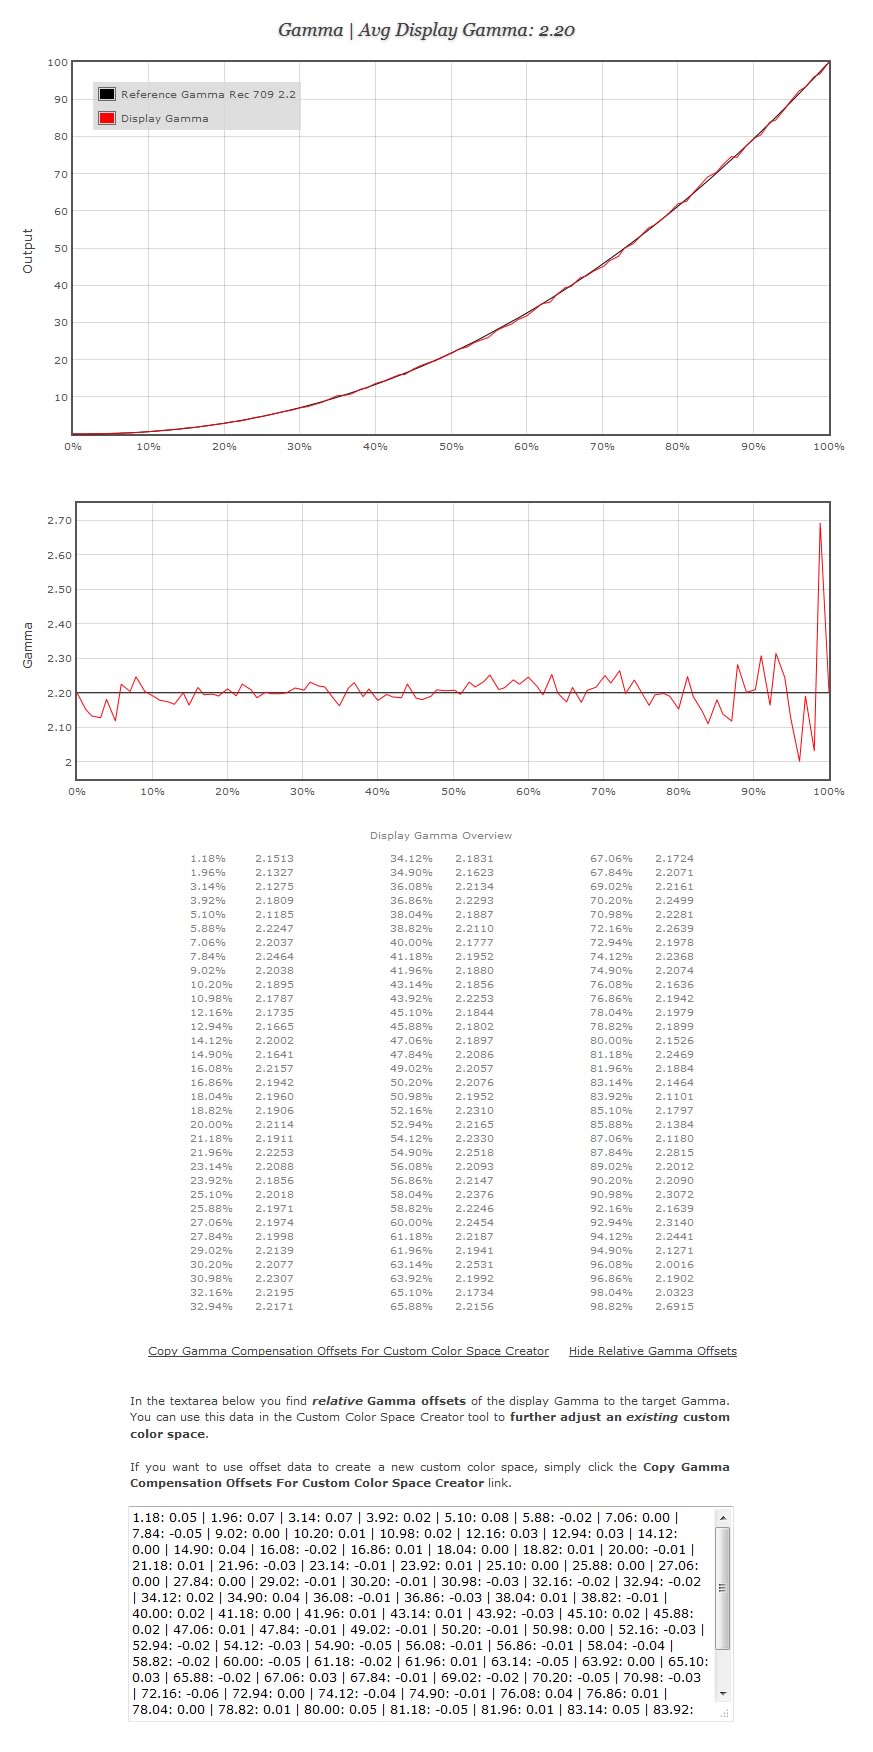
The report then shows two Gamma graphs. Below the second Gamma graphs you get a detailed overview of all points and their corresponding Gamma values. Below is an example of a 101 point Greyscale evaluation.
Below the Display Gamma Overview you'll see 2 helper options: "Copy Gamma Compensation Offsets For Custom Color Space Creator" and "Show Relative Gamma Offsets" (this option was triggered in the pic below) - both can be used to quickly and very accurately create a custom color space with specific Gamma adjustment points to improve the Gamma and Greyscale performance of your calibration LUT.
For example, if you click the "Copy Gamma Compensation Offsets For Custom Color Space Creator" link, the Gamma compensations for the Gamma values that are displayed just above the link (in the Display Gamma Overview) will be copied so you can use them in the Lightspace Custom Color Space Creator to create a custom color space with a custom Gamma (that compensates for Gamma inefficiencies) - all Gamma adjustment points are automatically created for you from the copied data.
Screenshot of both Gamma graphs
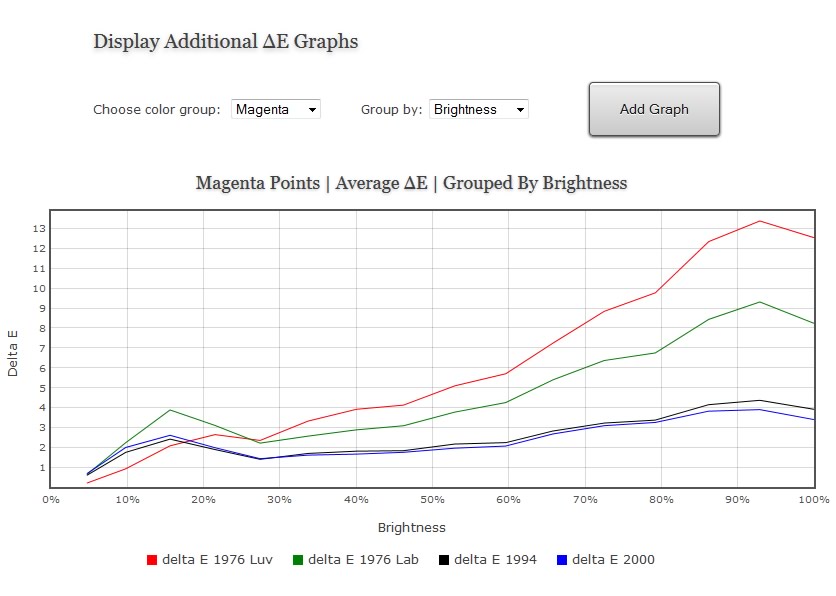
Finally, at the end of the report you will find an interface that allows you to display additional delta E graphs for any color group R|G|B|C|M|Y|Other
either grouped by Brightness or grouped by Saturation (saturation graphs require a minimum of 3 unique saturation stimuli in the profile).
Screenshot of Display Additional Delta E Graphs interface and a Delta E graph of Magenta Points grouped by Brightness created and displayed via the interface